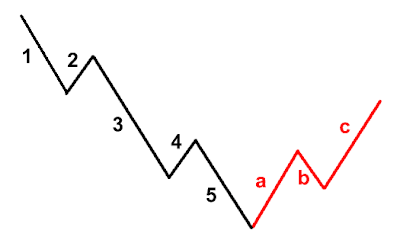
The 5-wave trends are then corrected and reversed by 3-wave countertrends. Letters are used instead of numbers to track the correction. Check out this example of smokin’ hot 3-wave corrective wave pattern!
Label Cloud
- bollinger
- brokers
- candlesticks
- channel
- charts
- facts
- fibonacci
- forex
- forex articles
- forex japan
- forex strategies
- indicator
- lingo
- lots
- macd
- margin call
- market hour
- marketiva
- moving everage
- news
- orders
- parabolic sar
- patterns
- pips
- pivot
- Preferences
- rollover
- rsi
- schmatterns
- setup
- stochastics
- support n resistance
- tips
- tradiings
- trading the articles
- trading the news
- trend
- versus
- yen
Monday, October 22, 2007
ABC Correction
The 5-wave trends are then corrected and reversed by 3-wave countertrends. Letters are used instead of numbers to track the correction. Check out this example of smokin’ hot 3-wave corrective wave pattern!
Posted by
de_kerinchi
at
1:41 AM
0
comments
Saturday, October 20, 2007
The 5-3 Wave Patterns
Ralph Nelson Elliott discovered that stock markets. They traded in repetitive cycles, which he pointed out were the emotions of investors and traders caused by outside influences (ahem, CNBC) or the predominant psychology of the masses at the time.
Elliott explained that the upward and downward swings of the mass psychology always showed up in the Chrise repetitive patterns, which were then divided into patterns he called "waves". He needed to claim this observation and so he came up with a super original name: The Elliott
Wave Theory.
The 5 – 3 Wave Patterns
Mr. Elliott showed that a trending market moves in what he calls a 5-3 wave pattern. The first 5-wave pattern is called impulse waves and the last 3-wave pattern is called corrective waves.
Let’s first take a look at the 5-wave impulse pattern. It’s easier if you see it as a picture:
That still looks kind of confusing. Let’s splash some color on this patern.
Here is a short description of what happens during each wave. I am going to use stocks for my example since stocks is what Mr. Elliott used but it really doesn’t matter what it is. It can easily be currencies, bonds, gold, oil, or Tickle Me Elmo dolls. The important thing is the Elliott Wave Theory can also be applied to the foreign exchange market.
Wave 1
The stock makes its initial move upwards. This is usually caused by a relatively small number of people that all of the sudden (for a variety of reasons real or imagined) feel that the price of the stock is cheap so it’s a perfect time to buy. This causes the price to rise.
Wave 2
At this point enough people who were in the original wave consider the stock overvalued and take profits. This causes the stock to go down. However, the stock will not make it to its previous lows before the stock is considered a bargain again.
Wave 3
This is usually the longest and strongest wave. The stock has caught the attention of the mass public. More people find out about the stock and want to buy it. This causes the stock’s price to go higher and higher. This wave usually exceeds the high created at the end of wave 1.
Wave 4
People take profits because the stock is considered expensive again. This wave tends to be weak because there are usually more people that are still bullish on the stock and are waiting to “buy on the dips”.
Wave 5
This is the point that most people get on the stock, and is most driven by hysteria. You usually start seeing the CEO of the company on the front page of major magazines as the Person of the Year. People start coming up with ridiculous reasons to buy the stock and try to choke you when you disagree with them. This is when the stock becomes the most overpriced. Contrarians start shorting the stock which starts the ABC pattern
Posted by
de_kerinchi
at
1:36 AM
0
comments
Monday, October 15, 2007
The Day, avoid to trade
Sundays: There is very little movement on these days. Trade this day if you want to start off your week with NEGATIVE pips.
Holidays: Banks are closed which means very little volume for whatever country is having the holiday. Holidays are great to trade when you would rather lose your money than take a day off and enjoy the other finer things in life.
News Reports: No one really knows where the price will go when a news report comes out. You could lose a fortune trading during news releases if you don't know what you're doing. Price during these times become unpredictable.
Posted by
de_kerinchi
at
2:00 AM
0
comments
Friday, October 12, 2007
Forex Pivot Point Trading Tips
• If price at PP, watch for a move back to R1 or S1.
• If price is at R1, expect a move to R2 or back towards PP.
• If price is at S1, expect a move to S2 or back towards PP.
• If price is at R2, expect a move to R3 or back towards R1.
• If price is at S2, expect a move to S3 or back towards S1.
• If there is no significant news to influence the market, price will usually move from P to S1 or R1.
• If there is significant news to influence the market price may go straight through R1 or S1 and reach R2 or S2 and even R3 or S3.
• R3 and S3 are a good indication for the maximum range for extremely volatile days but can be exceeded occasionally.
• Pivot lines work well in sideways markets as prices will most likely range between the R1 and S1 lines.
• In a strong trend, price will blow through a pivot line and keep going.
Posted by
de_kerinchi
at
1:27 AM
0
comments
Tuesday, October 9, 2007
How to Trade with Pivot Points
Breakout Trades
The pivot point should be the first place you look at to enter a trade, since it is the primary support/resistance level. The biggest price movements usually occur at the price of the pivot point.
Only when price reaches the pivot point will you be able to determine whether to go long or short, and set your profit targets and stops. Generally, if prices are above the pivot it’s considered bullish, and if they are below it’s considered bearish.
Let’s say the price is hovering around the pivot point and closes below it so you decide to go short. Your stop loss would be above PP and your initial profit target would be at S1.
However, if you see prices continue to fall below S1, instead of cashing out at S1, you can move your existing stop-loss order just above S1 and watch carefully. Typically, S2 will be the expected lowest point of the trading day and should be your ultimate profit objective.
The converse applies during an uptrend. If price closed above PP, you would enter a long position, set a stop loss below PP and use the R1 and R2 levels as your profit objectives.
Range-bound Trades
The strength of support and resistance at the different pivot levels is determined by the number of times the price bounces off the pivot level.
The more times a currency pair touches a pivot level then reverses, the stronger the level is. Pivoting simply means reaching a support or resistance level and then reversing. Hence, the word “pivot”.
If the pair is nearing an upper resistance level, you could sell the pair and place a tight protective stop just above the resistance level.
If the pair keeps moving higher and breaks out above the resistance level, this would be considered an upside “breakout”. You would also get stopped out of your short order but if you believe that the breakout has good follow-through buying strength, you can reenter with a long position. You would then place your protective stop just below the former resistance level that was just penetrated and is now acting as support.
If the pair is nearing a lower support level, you could buy the pair and place a stop below the support level.
Theoretically Perfect?
In the real world, pivot points don’t work all the time. Price tends to hesitate around pivot lines and at times it’s just ridiculously hard to tell what it will do next.
Sometimes the price will stop just before reaching a pivot line and then reverse meaning your profit target doesn’t get reached. Other times, it looks like a pivot line is a strong support level so you go long only to see the price fall, stop you out, then reverse back into your direction.
You must be very selective and create a pivot point trading strategy that you intend to strictly follow.
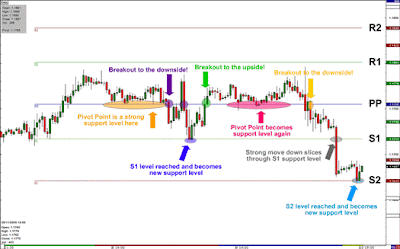
Let’s go look at a chart to see just how difficult and easy pivot points might be.
Look at the orange oval. Notice how the PP was a strong support but if you went long on PP, it never was able to rise up to R1.
Look at the first purple circle. The pair broke down through PP but failed to reach S1 before reversing back to PP. On the second break down though (second purple circle), the pair did manage to reach S1 before once again reversing back to PP.
Look at the pink oval. Again, PP acted as strong support but never was able to rise up to R1.
On the yellow circle, the pair broke out to the downside again, sliced right through S1, and managed to fall all the way down to S2.
If you ever attempted to go long on this chart, you would have been stopped out every single time. Personally, we would have not even thought about buying this pair - Why not? Well we have a little secret. What we didn’t show you regarding this chart was that this pair was trending down for quite some time now. Remember the “trend is your friend”.
Posted by
de_kerinchi
at
1:22 PM
0
comments
Thursday, October 4, 2007
How to Calculate Pivot Points
The calculation for a pivot point is shown below:
Pivot point (PP) = (High + Low + Close) / 3
Support and resistance levels are then calculated off the pivot point like so:
First level support and resistance:
First support (S1) = (2*PP) – High
First resistance (R1) = (2*PP) – Low
Second level of support and resistance:
Second support (S2) = PP – (High – Low)
Second resistance (R2) = PP + (High - Low)
Don’t worry you don’t have to perform these calculations yourself. Your charting software will automatically do it for you and plot it on the chart.
Also keep in mind that some charting software also provides additional pivot point features such as a third support and resistance level and intermediate levels or mid-point levels (levels in between the main pivot point and support and resistance level).
These “extra levels” aren’t as significant as the main five but it doesn’t hurt to pay attention to them. Here’s an example:
Posted by
de_kerinchi
at
11:19 AM
0
comments
Tuesday, October 2, 2007
Pivot Points
Pivot points are especially useful to short-term traders who are looking to take advantage of small price movements.
Pivot points can be used by both range-bound traders and breakout traders. Range-bound traders use pivot points to identify reversal points. Breakout traders use pivot points to recognize key levels that need to be broken for a move to be classified as a real deal breakout.
Here is an example of pivot points plotted on a 1-hour EUR/USD chart:
Posted by
de_kerinchi
at
1:16 AM
0
comments
Monday, October 1, 2007
Reverse Head and Shoulders
Here you can see that this is just like a head and shoulders pattern, but it’s flipped upside down. With this formation, we would place a long entry order above the neckline. Our target is calculated just like the head and shoulders pattern. Measure the distance between the head and the neckline, and that is approximately the distance that the price will move after it breaks the neckline.
You can see that the price moved up nicely after it broke the neckline. WE know you’re thinking to yourself, “the price kept moving even after it reached the target.”
If your target is hit, then be happy with your profits. However, there are strategies where you can lock in some of your profits and still keep your trade open in case the price continues to move your way. You will learn about those later on in the course.
Posted by
de_kerinchi
at
8:06 AM
0
comments
Labels: forex, patterns, schmatterns
Technorati Tags: Forex, Forex trading course, online currency trading courses, education, training, seminars, learning, courses, forex futures trading